coronavirus
CARES Act - The COVID-19 Relief Package and What it Means for You
Making sense of the CARES Act and what it means for you.
An illustrated example of how viruses (like COVID-19) spread in a community.
We are in an interesting moment in history with the coronavirus pandemic. It seems like all this upheaval and all these changes have come out of nowhere, and it's hard to know what is actually happening. There is so much data out there, but it is difficult to comprehend such large scale numbers. That's what this article is here to help with.
Since the global scale are kind of hard to digest, let's look at how viruses like COVID-19 spread in a neighborhood (around 2,000 people or 500 houses).
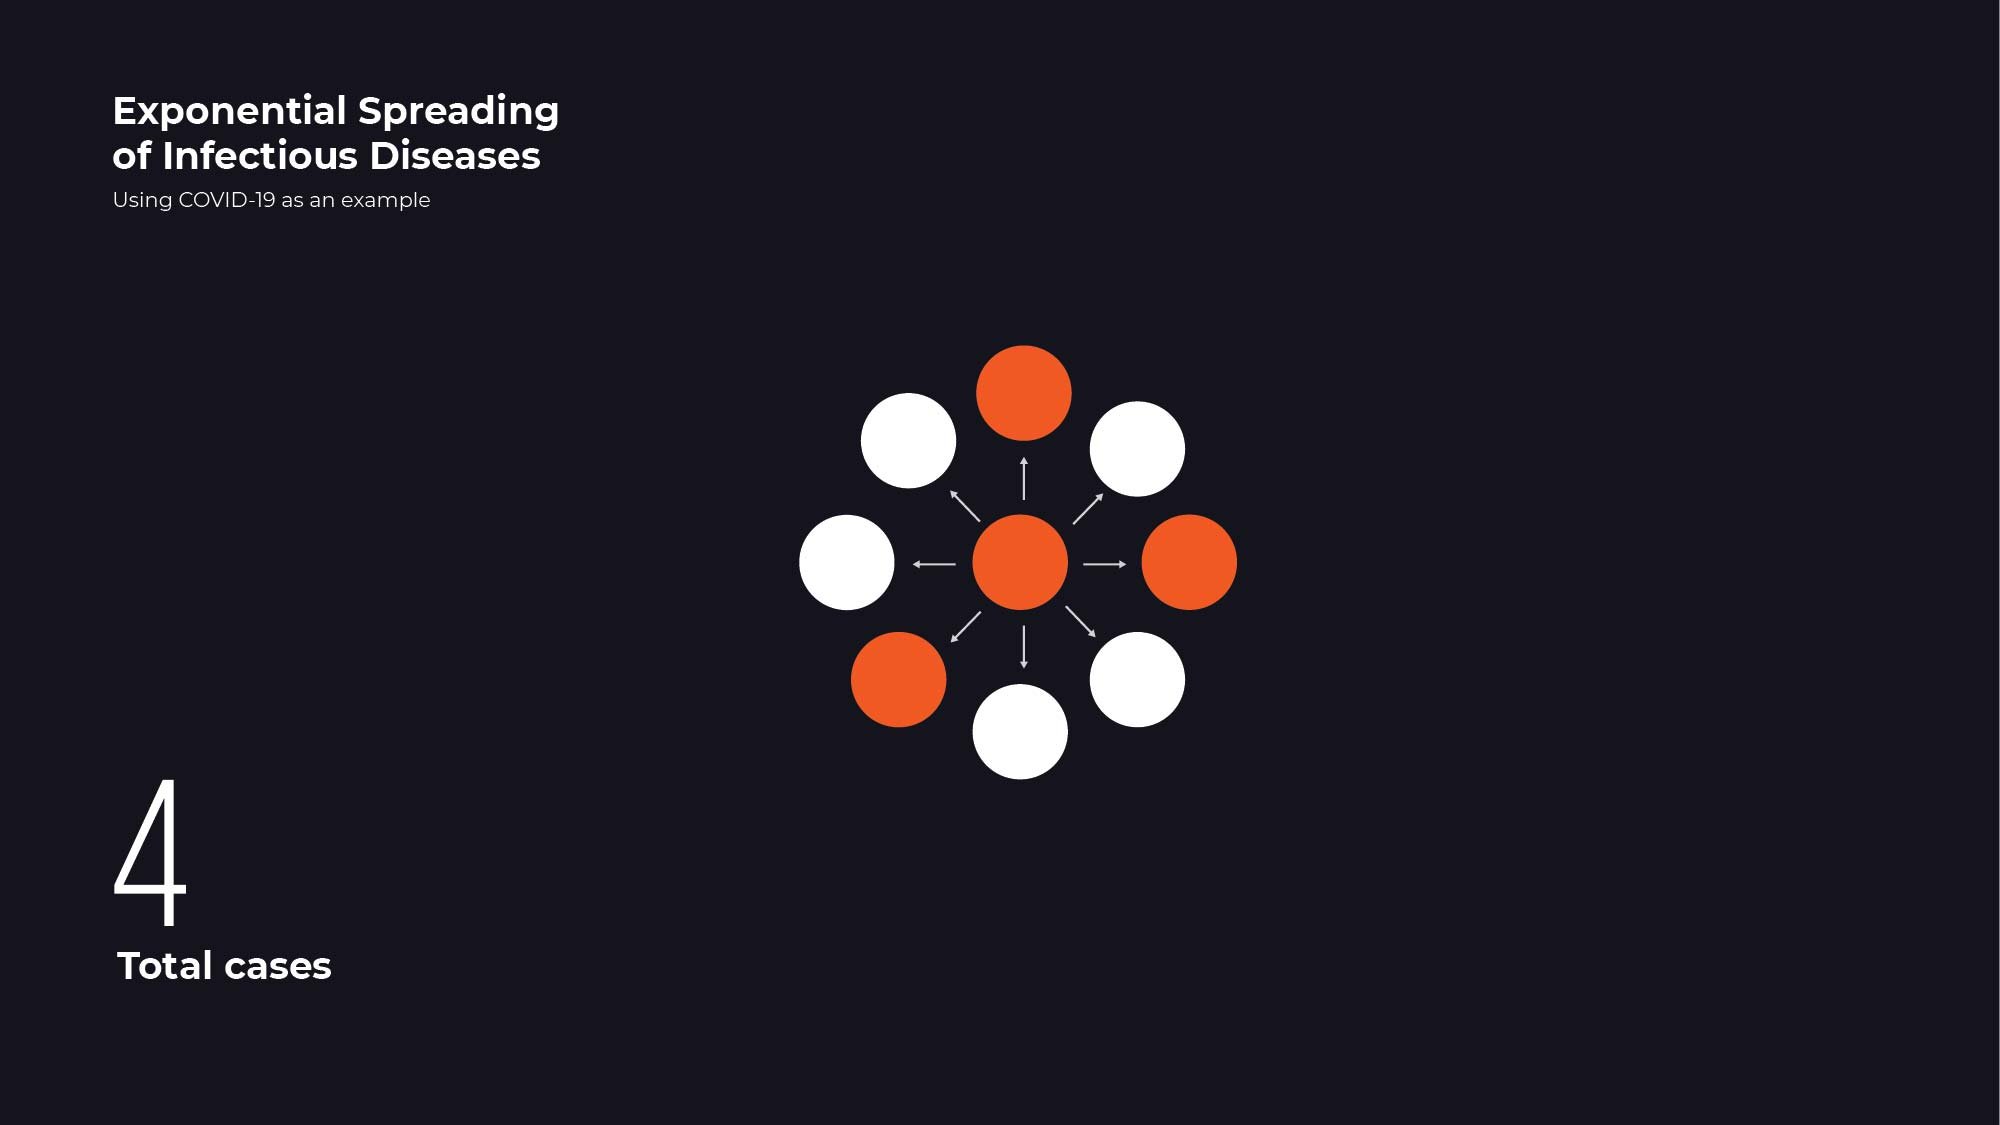
Before your community had any cases of the coronavirus, there was no threat because no one could spread infection. However, somehow, one person in the community does get infected. In this example, maybe that person was recently exposed on a trip they took out of the country. That person brings the virus back home, where no one has immunity to it.
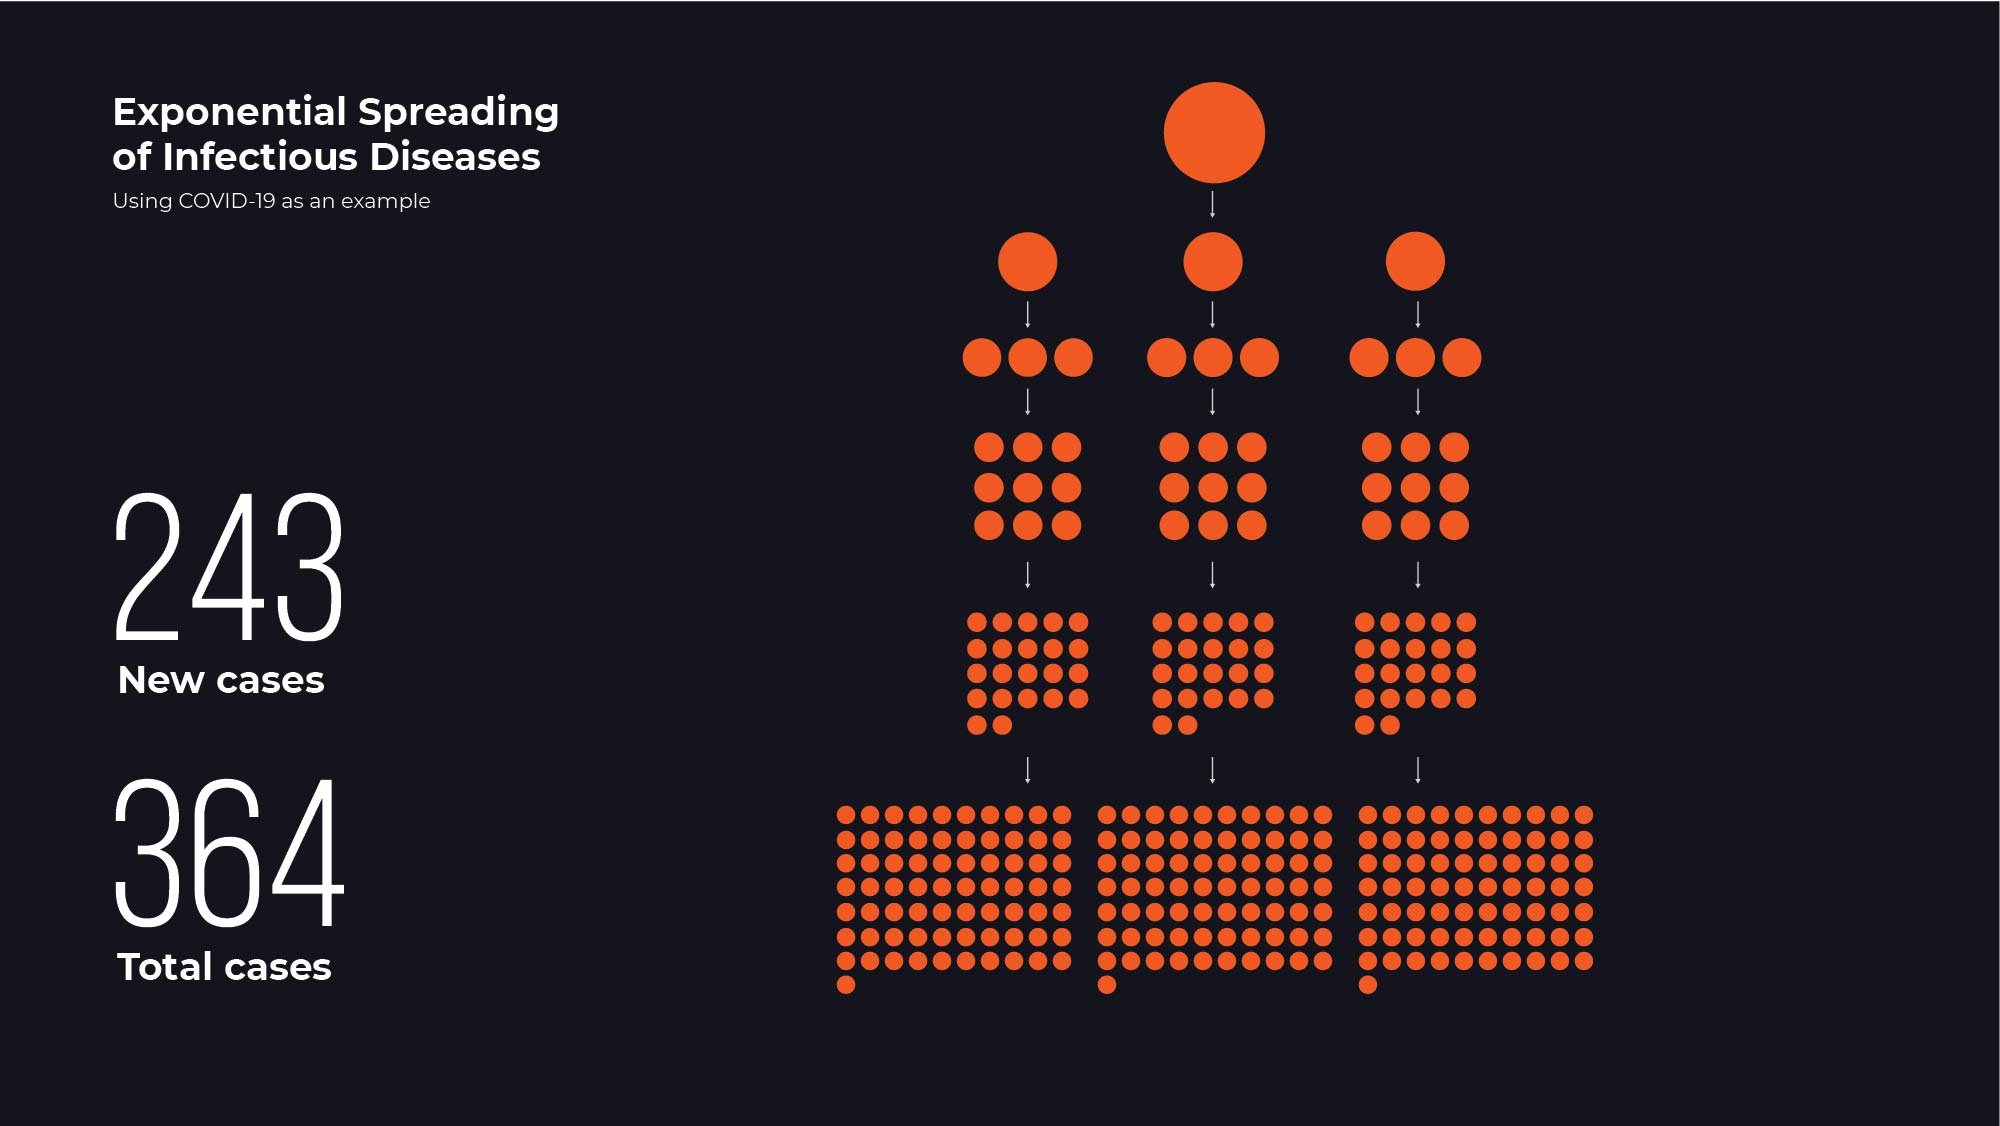
Data so far from the COVID-19 outbreak shows an infection rate of about 3, meaning that for every person infected, they will likely infect another 2-4 people if they are not isolated while the virus runs its course. we will use the number 3 for our illustration
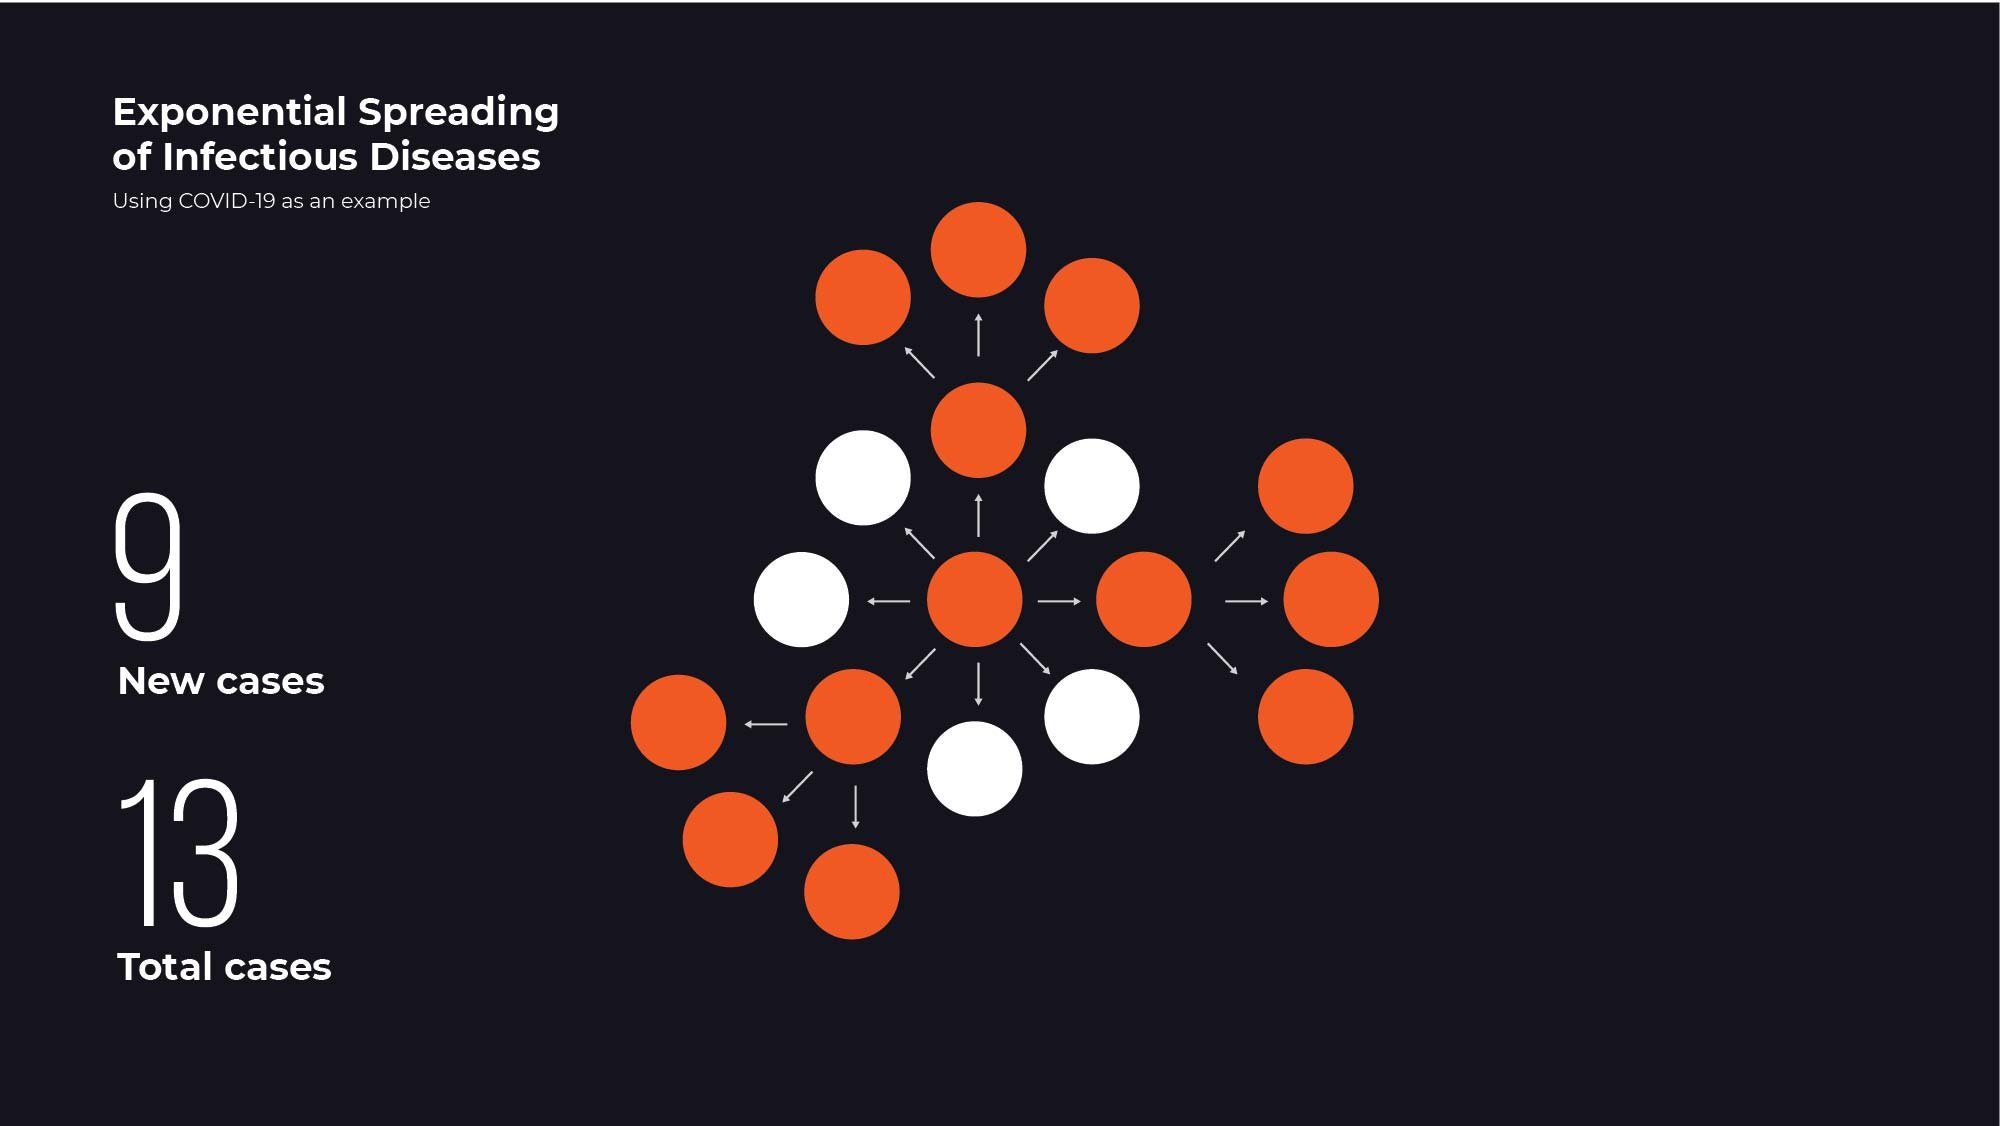
After returning home, Person 1 infects 3 others in the community. Then those 3 spread it to 3 others each, causing 9 new cases, bringing our total number of positive cases in the community to 13.
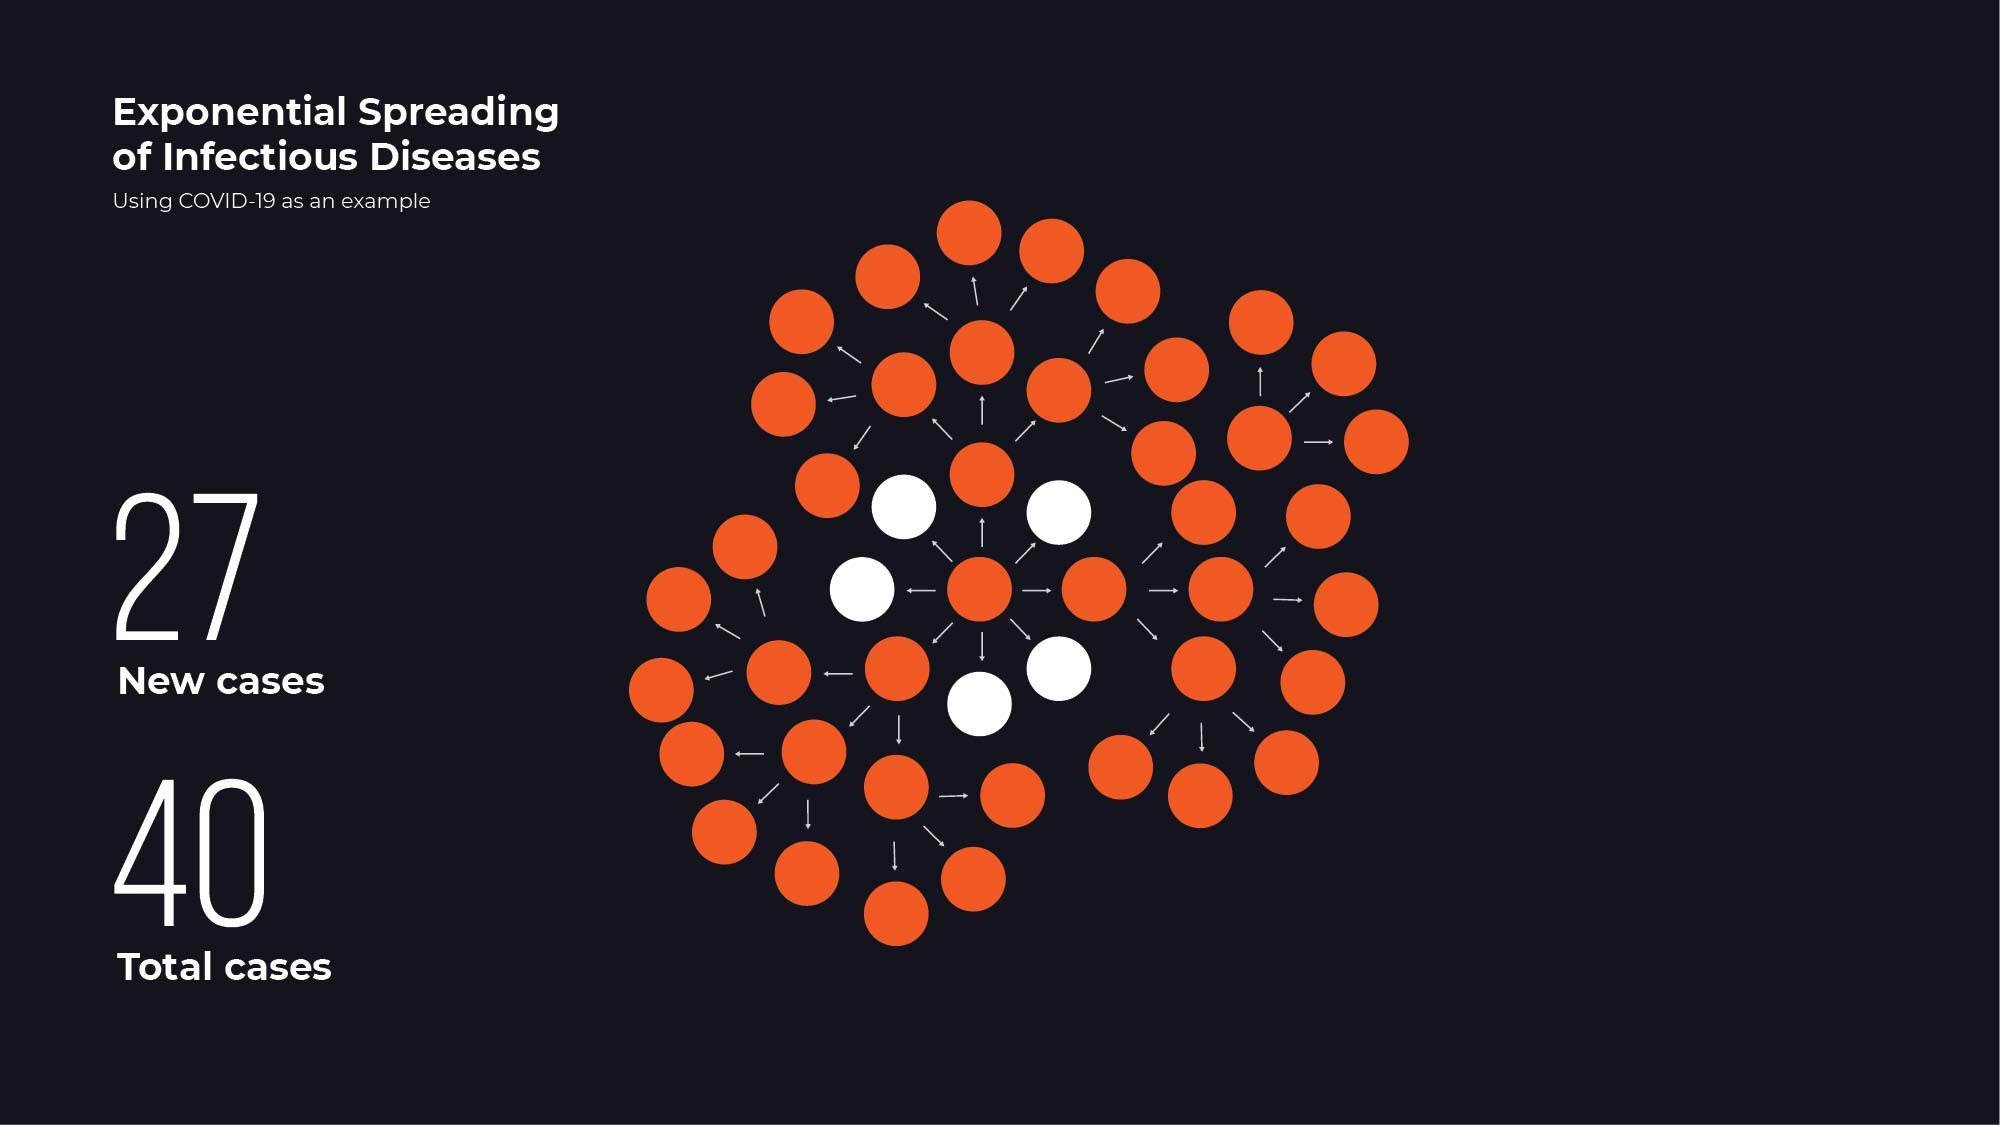
This may have only taken a few days, since we interact with so many people as we go about our business. A few days later, our 9 new cases have each spread it to 3 more people each. The virus has now penetrated 40/2,000 people, or about 2%.
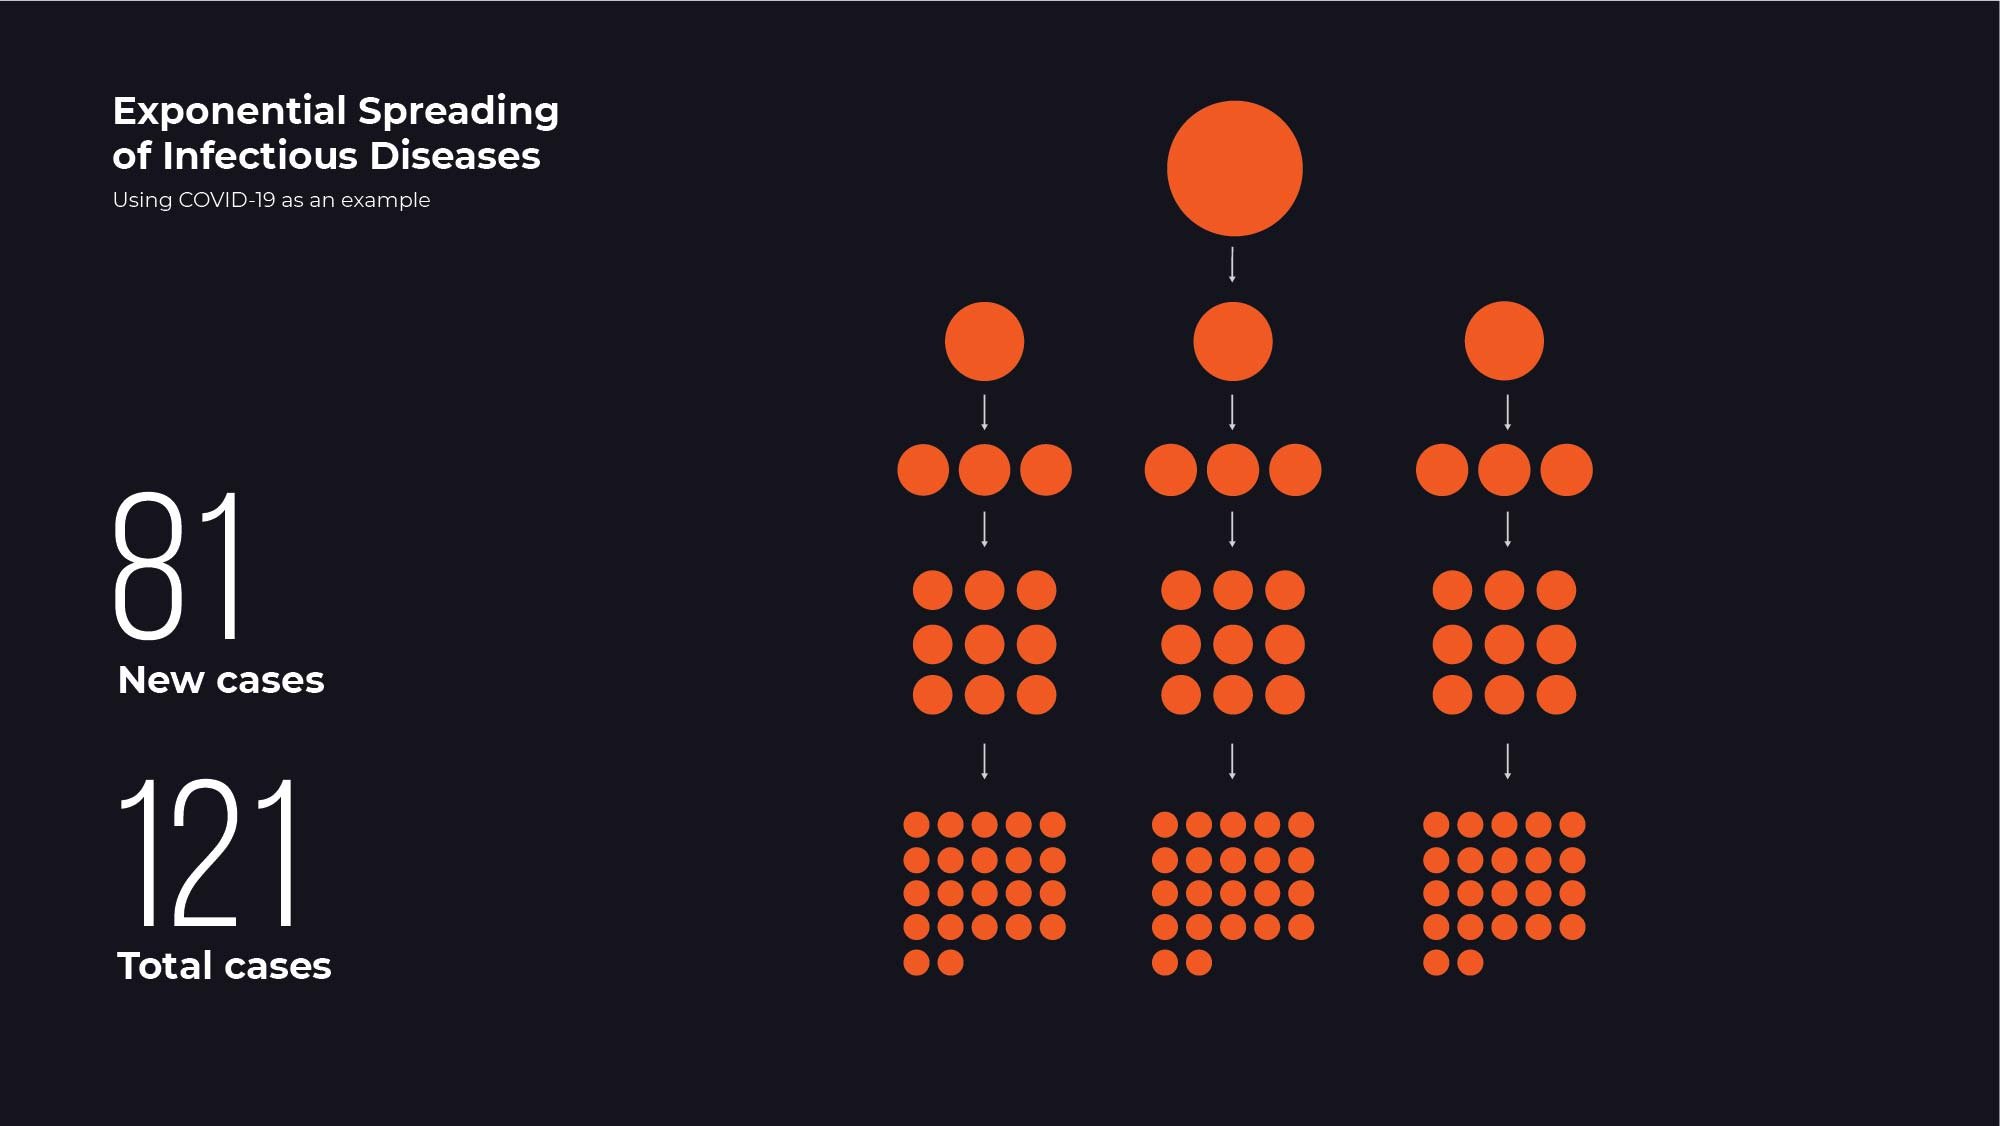
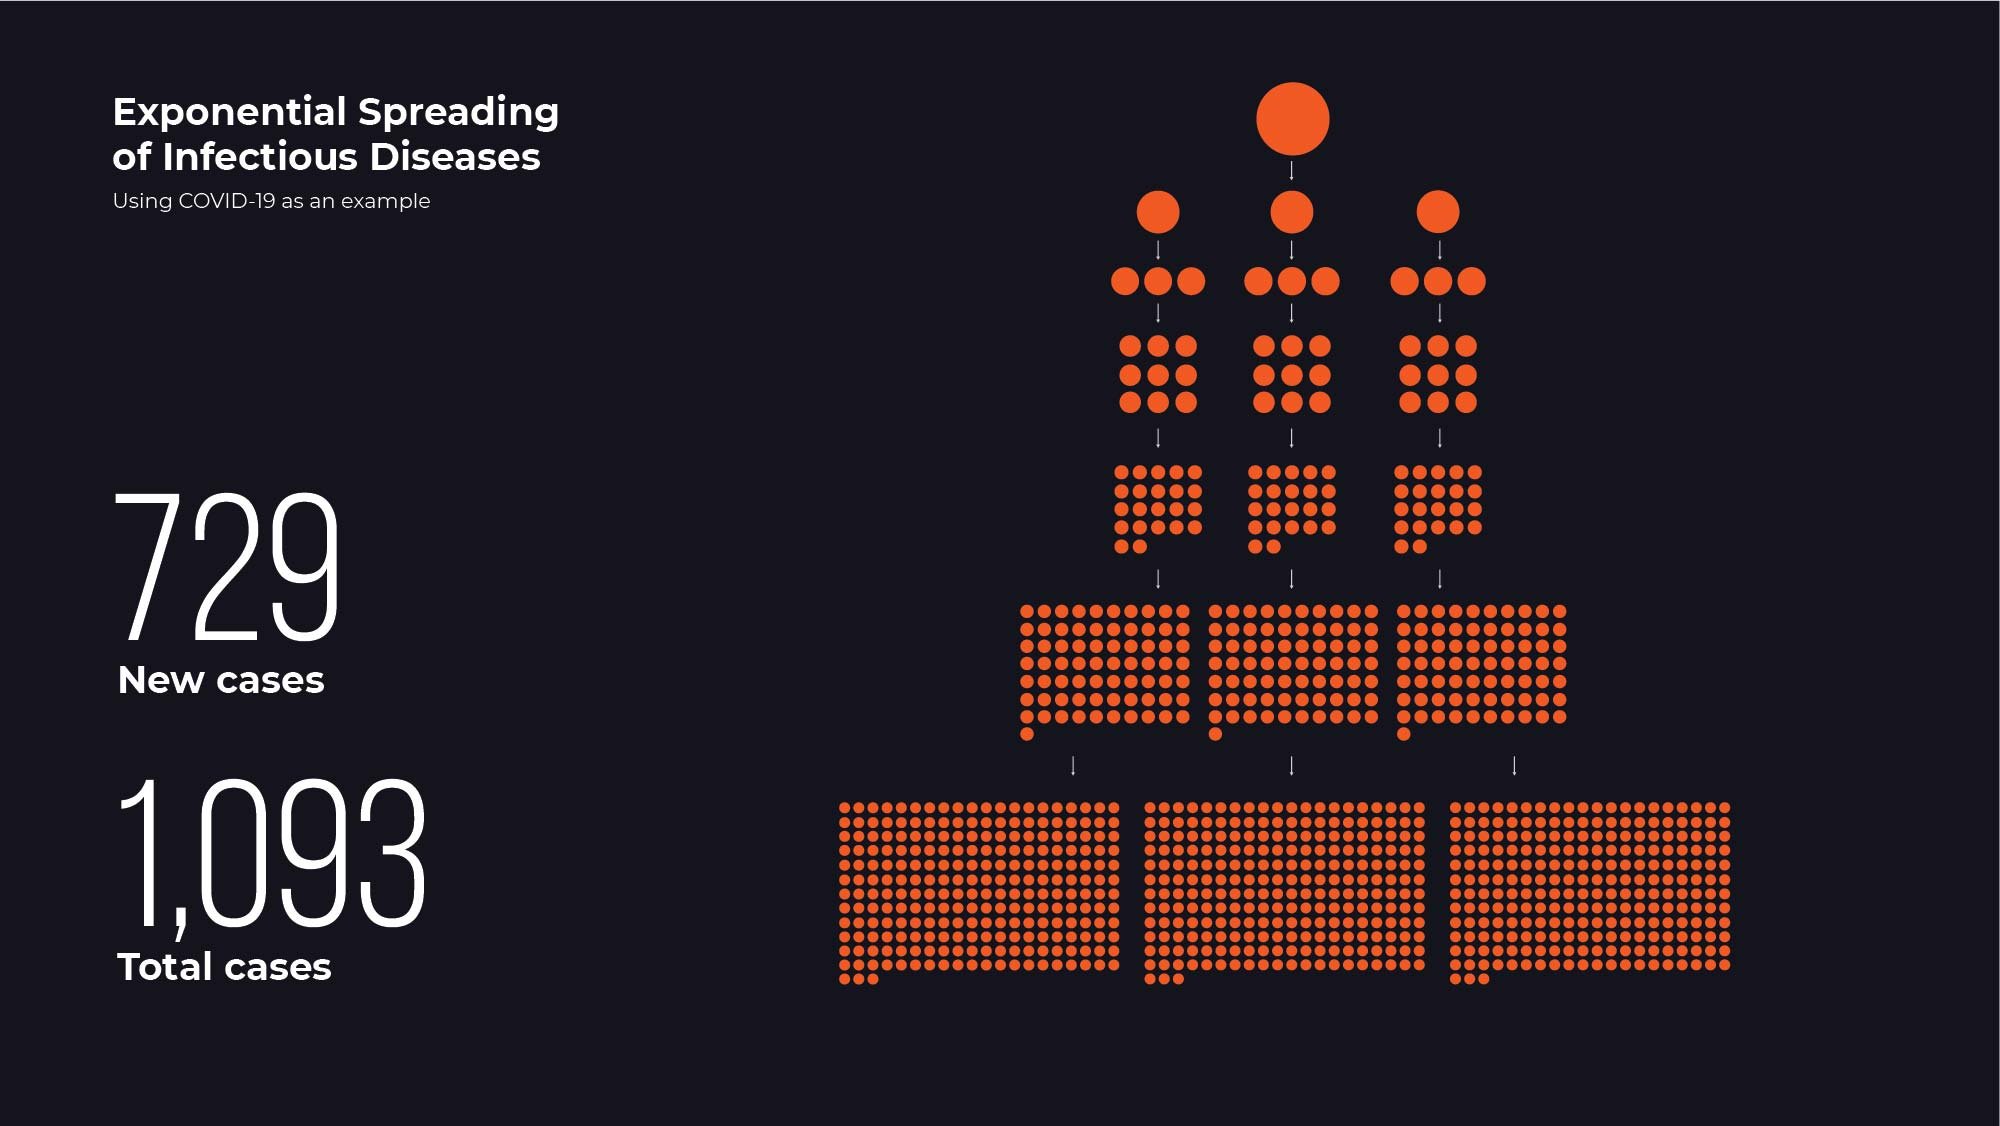
That may seem small, but a few days later, we are hitting the point where I can no longer fit all the circles neatly in my graphic :) Within two weeks of Person 1 bringing the virus, we've now jumped really fast to 6% of the neighborhood getting infected. The local hospital is feeling strained as they care for as many as they can, but usually people don't get sick all at once, so there aren't enough resources to go around.
Within a few more days, if you can believe it, almost every house in the neighborhood of 500 houses, could have an infected person in it.
Five days later, half of your neighborhood has the disease. It spread so quickly because no one had immunity built up from previous exposure. That's why viral infections have such power and why it is difficult to contain them once they get spread even a little bit.
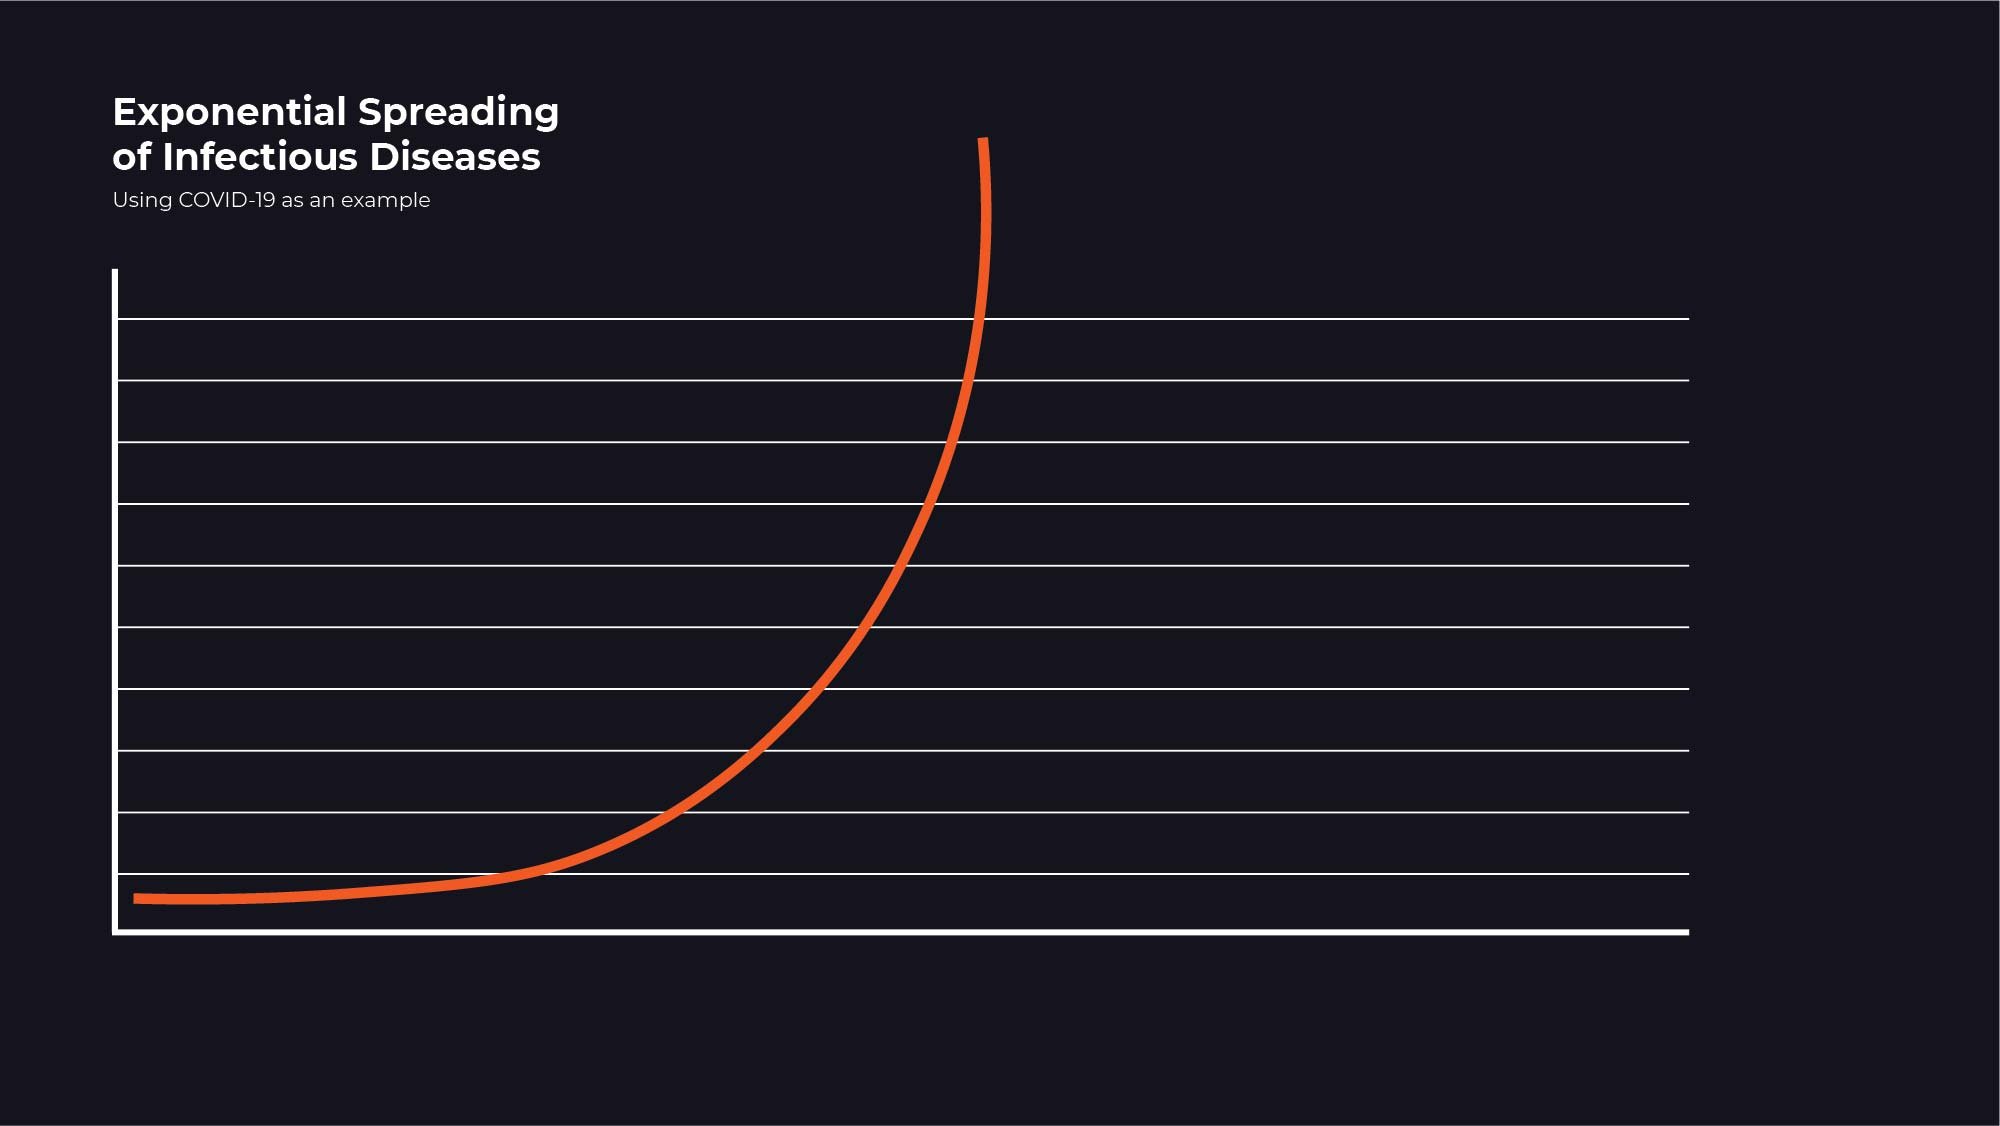
These huge jumps in cases are what is called "exponential spreading". If we were to continue replicating the case count by 3's, we would get a graph that looks like this. At the time of writing this, we are experiencing this exponential curve right now. Cases are jumping at a faster rate, and it kind of feels like that climb up the first hill of a big roller coaster. We are wondering when it it going to level out and stop climbing so fast.
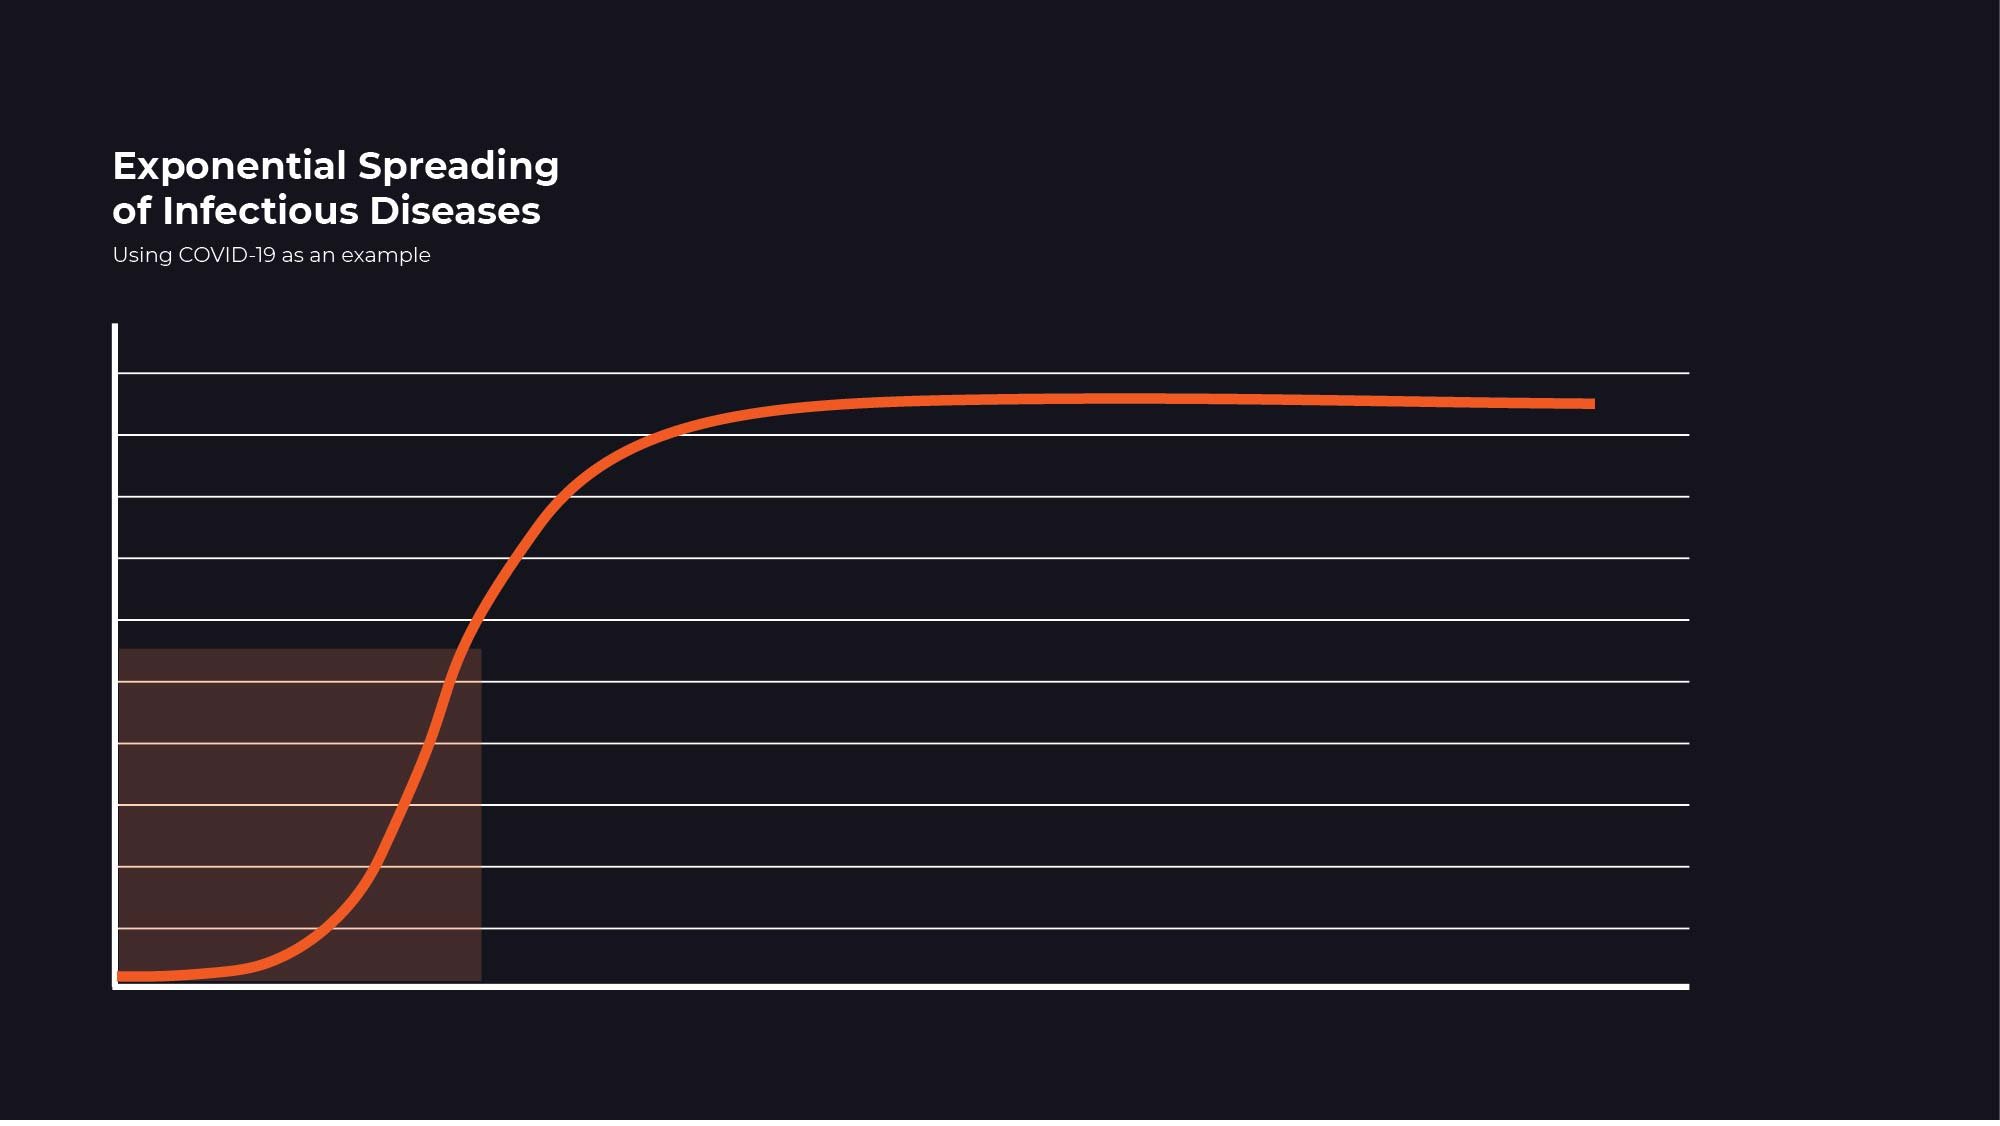
Luckily, it will level out. As the infection spreads through the entire population, eventually there will be no more new cases, since there is no one left who hasn't already been exposed. So as the line approaches the population size, it has to level out.
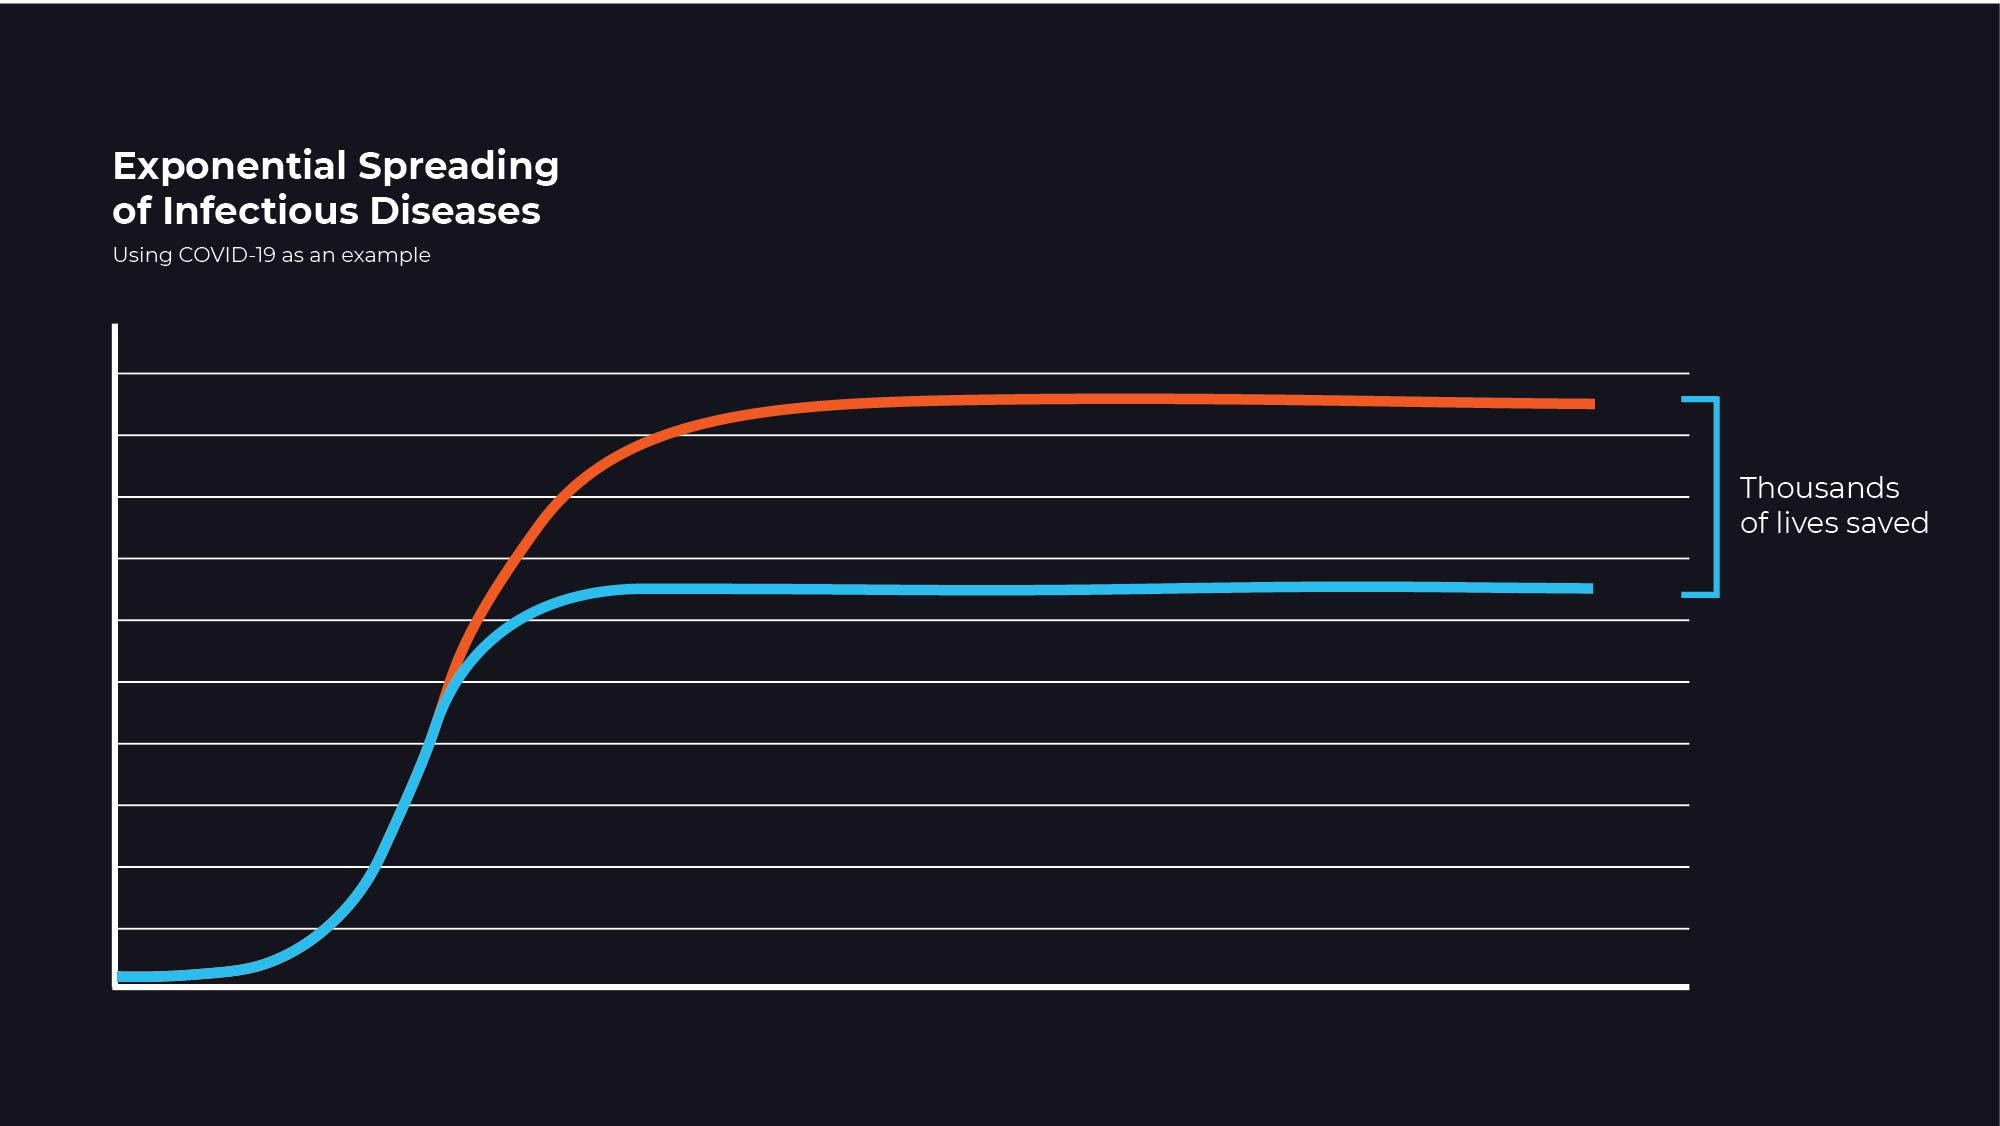
You can see in the highlighted portion how the exponential curve is what starts out a level curve (called a logarithmic curve). So while we are experiencing exponential case growth right now, we know it can't last forever.
Of course, no one wants to see the virus infect everyone. That would cause so much unnecessary suffering and death, and we all are committed to protecting life and well being. That is where your individual choices can have a HUGE impact on reducing the spread.
In the graph below, the blue line represents a scenario where we all follow all the recommendations from the experts on how to reduce spread, including social distancing. If all of us stay home, wash our hands, don't go near anyone if we are sick, and physically distance ourselves from others by a minimum of 6 feet, we can allow the virus to run its course only in those already infected and cause the curve to level out much faster. The gap between the lines represents tens of thousands of lives saved.
It's truly up to you and me. We have to choose saving lives over everything else.
We're in this together.
For a more detailed example of COVID-19 and exponential curves, check out this video:
Making sense of the CARES Act and what it means for you.
Illustrated example of how social distancing can impact the spread of a virus.
Choosing between in-person counseling and telehealth? Discover the pros and cons of each, including convenience, personal connection, privacy,...